Math questions / Climate
How does climate impact the design of a school building?
"This building looks the way it does because of where it is located."
- architect of the Nueva School
Climate impacts the design of a school building in many ways. The number of windows, the types of building materials used, the arrangement of the buildings on the site, even the number of doors you must pass through to first enter the building, are indications of how open or protected the building must be to the heat and cold.
In a temperate climate such as Hillsborough, CA, the Nueva School was designed with outdoor hallways and stairways. Students move from one building to another throughout the year, without having to worry too much about a wide range of temperatures.
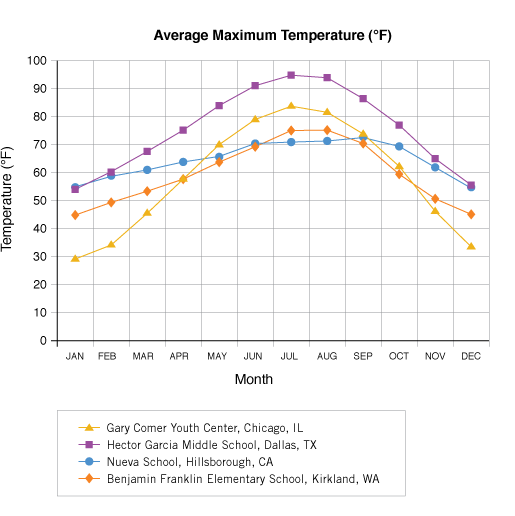
The graph below illustrates the average maximum temperature of four featured schools in four cities: Gary Comer Youth Center (Chicago, IL); Hector Garcia Middle School (Dallas, TX); Nueva School (Hillsborough, CA); and Benjamin Franklin Elementary (Kirkland, WA). Use this graph to answer the following questions.

1.
Which city has the greatest range of temperatures? Why do you think this is the case?
2.
Which city has the least range of temperatures? Why do you think this is the case?
3.
Which two cities have a similar range of average maximum temperatures throughout the year?
4.
Based on the graph, which city has the most temperate (or mild) climate? How is this shown in the graph?
5.
Based on the graph, which city has the hottest summers? How is this shown in the graph?
6.
Based on the graph, which city has the coldest winters? How is this shown in the graph?
7.
Which city do you think has a climate that is most similar to your own city?
8.
If you were designing new schools in each of these four cities and climates, which climates would require more design strategies to help naturally ventilate and cool the buildings throughout the year? Explain your answers.
9.
Which of the four climates would require more design strategies to help naturally warm the buildings throughout the year? Explain your answers.
10.
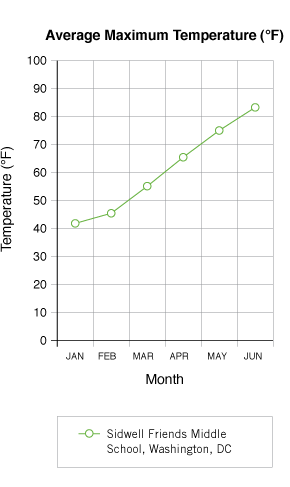
The graph below illustrates the average maximum temperature for Sidwell Friends Middle School (Washington, DC) from January to June. Draw a sketch to complete the graph for the remainder of the year. Explain how you made your decisions.

11.
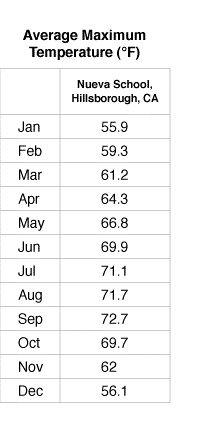
Use a graphing utility and the table below, listing the average maximum temperatures at the Nueva School in Hillsborough, to plot the months of the year (1 – 12).

12.
How would you describe the general shape of the graph you created?
13.
Find the regression equation for this data.
14.
What is the regression equation? Graph that equation.
15.
What is the range of maximum temperatures for Hillsborough, CA?
16.
How could you use this graph to you created to determine the average maximum temperature for the entire year?
17.
What is the average maximum temperature in Hillsborough, CA for the entire year?
18.
When finding the equation to model the data, did you use a sinusoidal regression? If not, find it now and compare your equation/graph to the sinusoidal equation/graph.
19.
What is the amplitude of the sinusoidal curve?
20.
How is the amplitude of the sinusoidal curve related to the range of temperatures?
21.
What is the vertical shift for the curve? What relationship does this have to the data?
22.
Use a graphing utility and the table below, listing the average minimum temperatures at the Nueva School, to plot the months of the year (1 – 12).

23.
Find a regression equation to model this data.
24.
Compare the two graphs you created for month vs. average maximum temperature and the month vs. minimum temperature in Hillsborough, CA. List two things that are similar between the two graphs. List two things that are different between the two graphs.
25.
How could you adjust the data for month vs. average minimum temperature so that it approximates the data for month vs. average maximum temperature? What would you have to do for this to happen?
26.
List your regression equations for month vs. average minimum temperature and month vs. average maximum temperature.
[Your equations should be written in this form: y = Asin B(x – C) + D; round values to two decimal places.]
27.
What is the value of D in each of your equations?
28.
Find the absolute value of the difference of the two D values.
29.
How does this value relate to the previous question regarding adjusting the data?
30.
How is the value of A in each of the equations related to the data?
31.
The maximum temperatures for a city (y) for each month (x) could be modeled by the following equation:
y = 10.3sin 0.5(x – 3.8) + 42.4
Based on this equation, what observations can you make about the maximum temperatures in the city?
32.
If you were to graph maximum temperature vs. minimum temperature for each month in a city, what would you expect the graph to look like?
33.
Graph the maximum temperature vs. minimum temperature for each month in a city. Was your prediction accurate?


