Math questions / Sunrise and Sunset
How can a school be positioned on its site to take advantage of path of the sun?
Think about your arrival at school in the morning during the fall and spring months versus the winter months. If your school is located in the northern hemisphere, it is likely that you start school in the dark each morning for several months during the winter. Due to the tilt of the earth, locations closer to the equator experience fairly consistent sunrise and sunset times throughout the year. But the further north you travel, the more widely these sunrise and sunset times vary.
When architects make decisions about how school buildings are designed, they must consider how much sunlight the buildings will receive at various times throughout the day. The size and location of the windows in classroom, for example, will impact how much electric lighting the school must use at various times throughout the school day. Likewise, as the sun rises and warms a location, the air temperature typically increases, which impacts the amount of heating or cooling needed in the building.
This set of math questions compares and contrasts two locations: one in a mild climate, the other in a harsher climate. Hillsborough, California (site of the Nueva School) and Anchorage, Alaska also have very different sunrise and sunset times during the year.
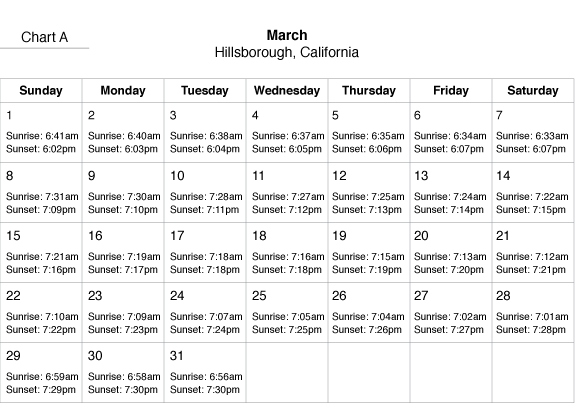
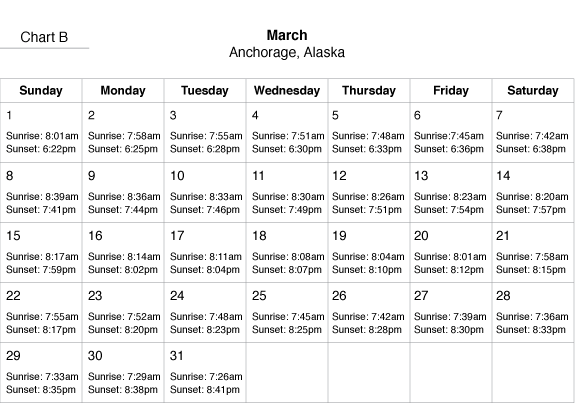
Use the sunrise data in Chart A below for March in Hillsborough, CA and in Chart B for March in Anchorage, AK to answer the following questions.
1.
At the Nueva School in Hillsborough, CA what is the sunrise time on March 3? What is the sunset time that same day?
2.
Compare the same information for a school in Anchorage, AK. What is the sunrise time on March 3? What is the sunset time that same day?
Hours of sunlight are defined as the time between sunrise and sunset. To perform this calculation we separate the day into the hours before 12:00pm (noon) and after 12:00pm (noon). For example, on a given day, the sun rises as 6:15am and sets at 7:30pm.
To calculate the sunlight for that city, first calculate how much sunlight there was before noon.
6:15am – 12:00pm (noon) = 5 hours 45 minutes
Then, calculate the amount of sunlight after noon.
12:00pm (noon) – 7:30pm = 7 hours 30 minutes
Total amount of sunlight = 12 hours 75 minutes, which also = 13 hours 15 minutes
3.
How many hours of sunlight does Hillsborough, CA receive on March 30?
4.
How many hours of sunlight does Anchorage, AK receive on March 30?
5.
On what day in March does Anchorage receive 13 hours and 9 minutes of sunlight?
6.
Express this amount of time as a decimal.
7.
Find the rate of change of the sunrise time from March 1 to March 5 in Hillsborough, CA and Anchorage, AK. Use the day of the month and convert the sunrise time to a decimal. Give the units for this rate. Is it positive or negative? What is the meaning of the sign of the rate of change?
8.
Compare the sunrise and sunset times for each city between Saturday, March 7 and Sunday March 8. What could account for this jump in sunrise and sunset times?
9.
Suppose that you want to calculate the rate of change in sunrise times between March 7 and March 17. What problem would you encounter in your calculation? Explain how to solve the problem and then calculate the rate of change in sunrise times.
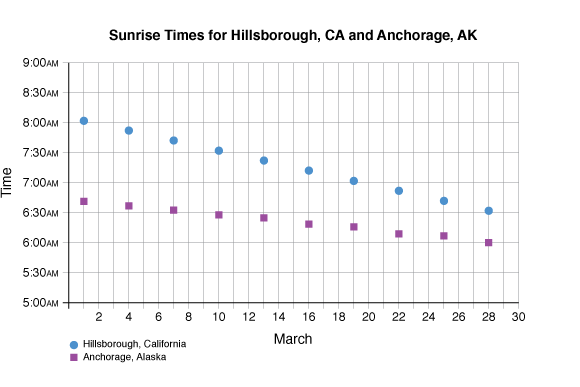
Use the scatter plots of the graph below, illustrating the approximate sunrise times for Hillsborough, CA and Anchorage, AK, to answer the following questions.
10.
Estimate the sunrise time for Anchorage, AK on March 1, March 8, March 22, and March 29. Express your answer in both time and a decimal, rounded to the nearest tenth.
11.
Both plots seem to be linear. Use the data in the tables to give the average rate of change for each plot. Use units in your answers.
12.
Explain the difference in the rate of change of sunlight based on the geographic location of the two cities on the planet. (hint: Hillsborough, CA has latitude of 37° North, while Anchorage, AK has a latitude of 61° North.)
Using the data from the chart, we can approximate a linear function for both cities where the input (x) is the day of the month and the output (y) is the time of day.
Anchorage, AK
y = –.042x + 8
Hillsborough, CA
y = –.025x + 6.7
13.
Use the two models above to predict the sunrise time on March 27 in Hillsborough, CA and Anchorage, AK. Give the meaning of each prediction.
14.
The model can also be used to predict outside of the data set. This is called extrapolation. Use the models to predict (or extrapolate) the sunrise time for December 1, which is 275 days after March 1. How accurate is this prediction? What does this say about the long-term accuracy of this model?
15.
Give the meaning of each number in both equations. Remember that the models were developed using data from the month of March.
16.
Use the same models to predict the sunrise time on March 12 in each city. Use the table to assess your accuracy.
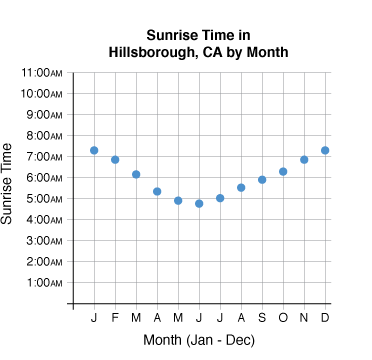
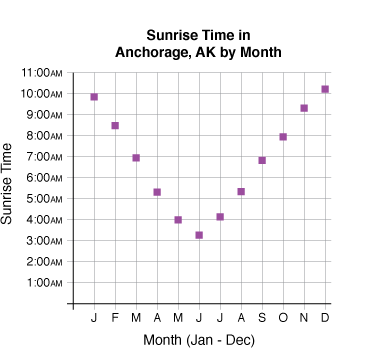
Use the two graphs below to answer the following questions. The graphs illustrate the sunrise times of Hillsborough, CA and Anchorage, AK on the 21st day of each month this year.
17.
Do you think the graphs for these two cities will look the same for next year? For last year? Why or why not?
18.
At what time(s) of the year is the sunrise time changing most slowly?
19.
At what time(s) of the year is the sunrise time changing most rapidly?
20.
Suppose you are a student at the Nueva School in Hillsborough, CA and your 8:00am first period classroom faces east. Knowing that the sun rises in the east, in what months of the year would you have no light from the sun during that time of day?
21.
Suppose that you are a student in Anchorage, AK and your 8:00am first period classroom faces east. Knowing that the sun rises in the east, in what months of the year would you have no light from the sun during that time of day?
22.
Give three ways that you think sunrise and sunset times might affect a school's schedule, building operation costs, or the daily life of students?
23.
The sunset time in Hillsborough, CA on June 21—the summer solstice and the day with the most amount of sunlight—is 7:34pm. The sunset time on December 21—the winter solstice and the day with the least amount of sunlight—is 4:53pm. Calculate the numbers of hours of sunlight on these two days of the year in Hillsborough.
24.
The sunset time in Anchorage, AK on June 21—the day with the most amount of sunlight—is 10:42pm. The sunset time on December 21—the day with the least amount of sunlight—is 3:41pm. Calculate the numbers of hours of sunlight on these two days of the year in Anchorage.
25.
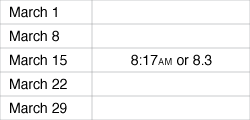
Below is a partially filled table listing the sunrise times in decimal form for Hillsborough, CA and Anchorage, AK. Use the data and a graphing calculator to determine the sinusoidal regression. Estimate the points, enter them in your data lists, and display the regression. (Use 1 – 12 for the months of the year and be sure that the calculator is set in radian mode.)

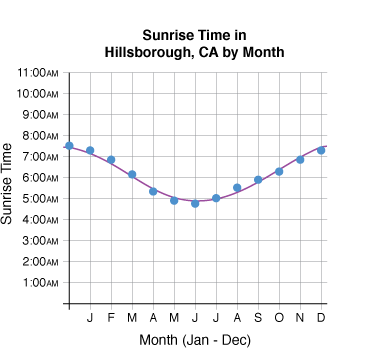
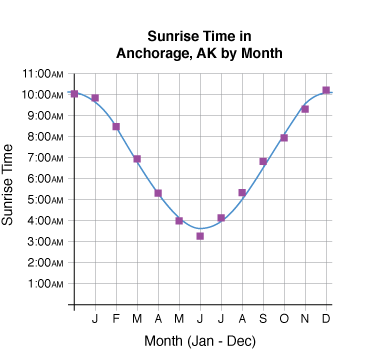
The two graphs below show sinusoidal models imposed on the data points. The models are:
Hillsborough, CA
sinusoidal regression
regEQ(x) = 1.31784*sin(27.7163*x+97.4785)+6.16655
Anchorage, AK
sinusoidal regression
regEQ(x) = 3.2396*sin(29.3408*x+91.3703)+6.84801
26.
Use your sinusoidal models to predict the time of sunrise in each city on December 1, which is 275 days after March 1. Compare your answer to the real data chart above. How accurate is your model?
